

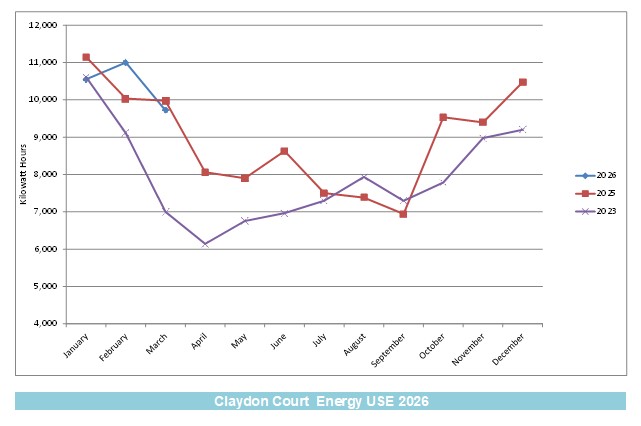
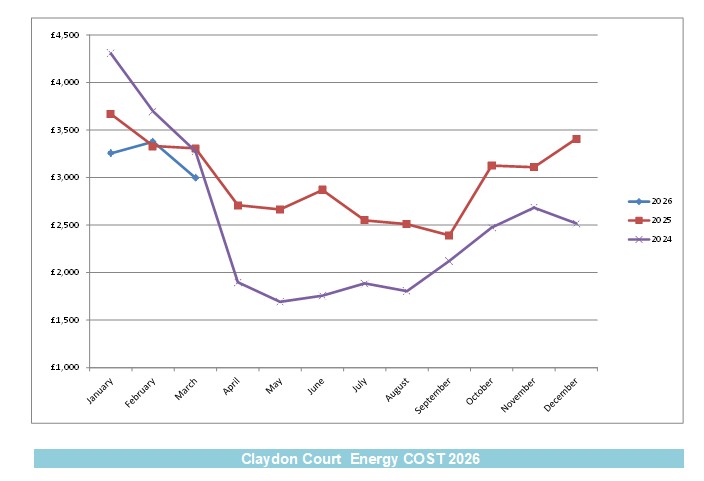
We measure and share energy use with colleagues monthly. It’s not that exciting for non-tenants however so we’re restricting updates to once a quarter.
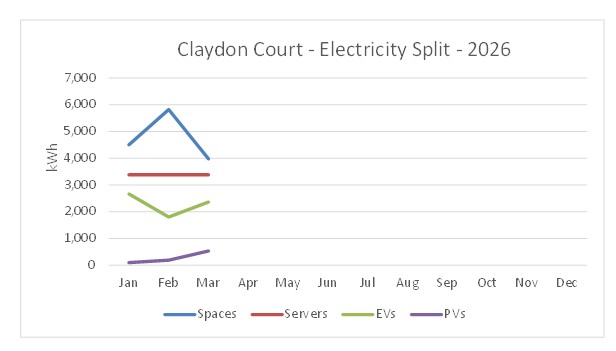
A new addition is the Split Chart which shows where energy comes from and where it goes. Energy use for our data centre is static but office space varies with climate.
EV chargers vary and account for over 20% of total use, this is encouraged with free-vend and a mixed blessing. Our PV panels don’t make a massive difference until the summer.